Setting Up a Dev Environment in Visual Studio Code #
Python Debugging #
1. Create a Python Virtual Environment #
python3 -m venv /path/to/new/virtual/environment
2. Start Virtual Environment #
| shell | command |
|---|---|
| bash/zsh | source |
| fish | source |
| csh/tcsh | source |
3. Install Requirements #
put the following in a file called requirements.txt
cocotb
debugpy
then call pip install -r requirements.txt
4. Setup Python Debugging in Visual Studio Code #
setup a launch.json file as follows:
{
    "version": "0.2.0",
    "configurations": [
        {
            "name": "Python: attach cocotb",
            "type": "python",
            "request": "attach",
            "host": "localhost",
            "port": 5679,
            "justMyCode":false,
        }
    ]
  }
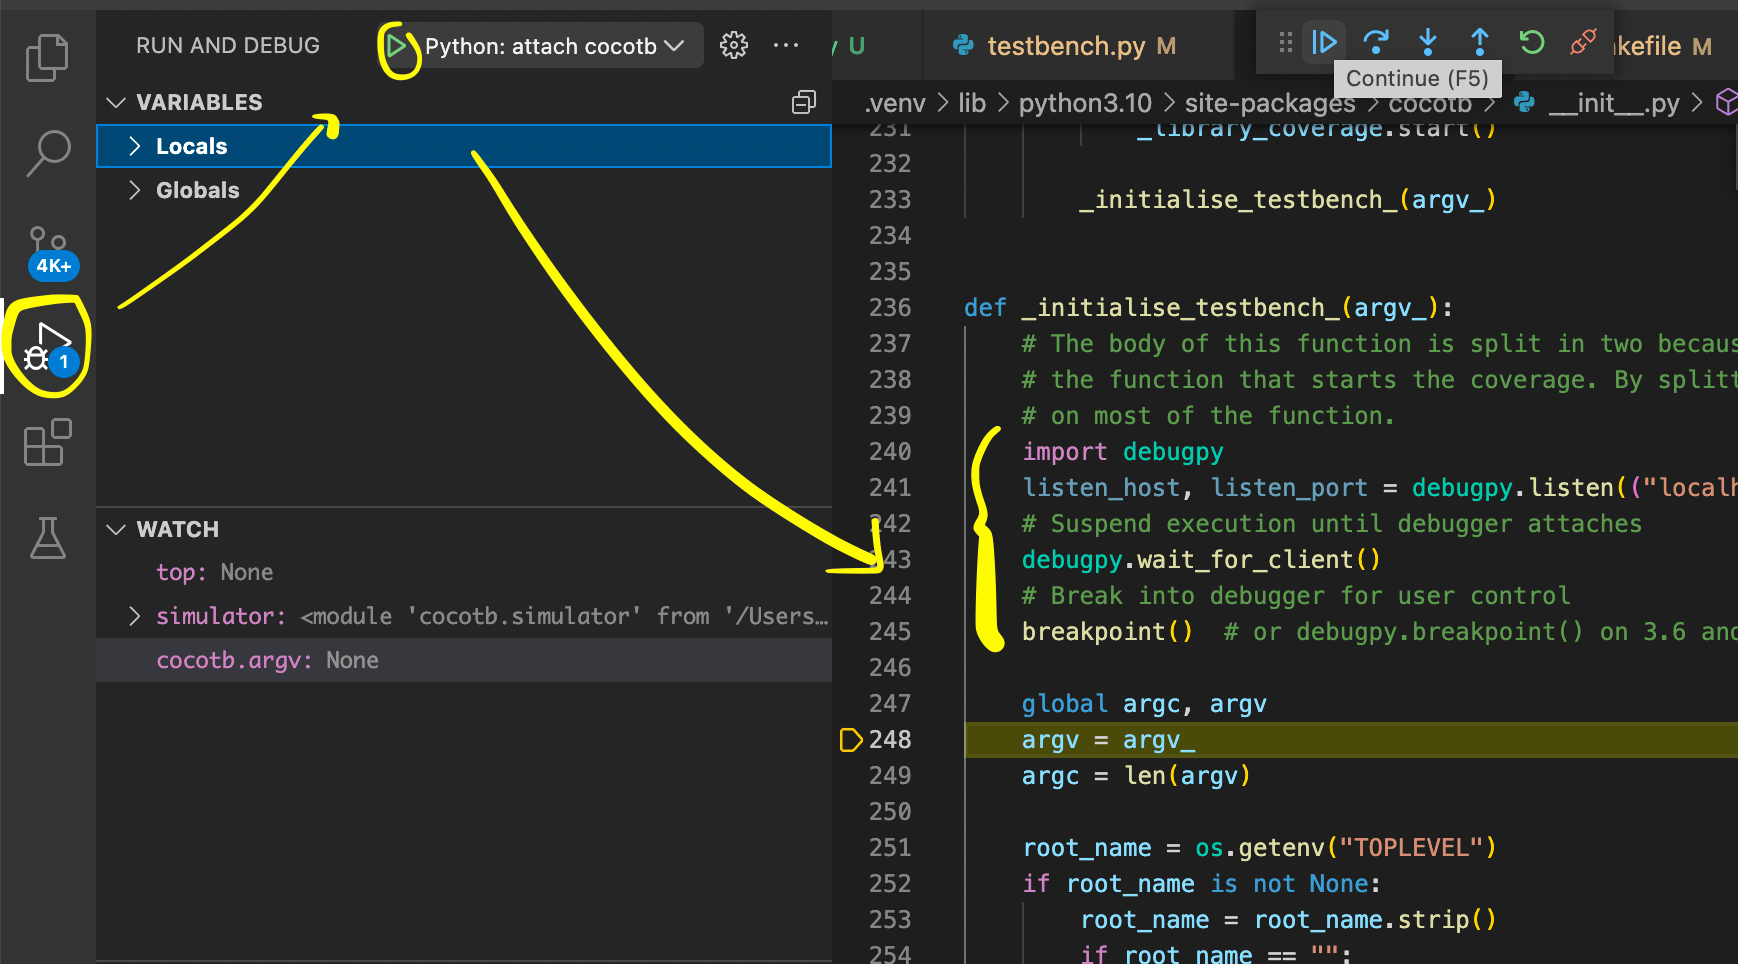
5. Set a Breakpoint #
put the following code where you want to set a breakpoint. For example, if I wanted to step through cocotb startup I’d put this code into __init__.py in my cocotb directory inside my virtual environment located at lib/python<version number>/site-packages/cocotb/__init__.py
    import debugpy
    listen_host, listen_port = debugpy.listen(("localhost", 5679))
    # Suspend execution until debugger attaches
    debugpy.wait_for_client()
    # Break into debugger for user control
    breakpoint()  # or debugpy.breakpoint() on 3.6 and below
5. Run make
#
run make in your cocotb testbench, it will halt and wait for you to connect the debugger.
6. Start Debug Session #
hit the debug button and in the left hand side pane, run “python: attach cocotb” to attach debugger.
Compiled Library Debugging (C/C++) #
Sorry to all readers, but I’m using a mac so this will be how to attach lldb to cocotb. lldb is mac’s built in debugger and is very similar to gdb.
- Run your cocotb testbench with
make COCOTB_ATTACH=200. This pauses cocotb in the_embed_init_pythonfunction ingpi_embed.cppfile for 200 seconds, you can set it to however many seconds you need.
output:
 make COCOTB_ATTACH=200
rm -f results.xml
/Library/Developer/CommandLineTools/usr/bin/make -f Makefile results.xml
rm -f results.xml
MODULE=testbench TESTCASE= TOPLEVEL=count_up TOPLEVEL_LANG=verilog \
         /opt/homebrew/bin/vvp -M .venv/lib/python3.10/site-packages/cocotb/libs -m libcocotbvpi_icarus   sim_build/sim.vvp
     -.--ns INFO     gpi                                ..mbed/gpi_embed.cpp:110  in set_program_name_in_venv        Using Python virtual environment interpreter at /.venv/bin/python
     -.--ns ERROR    gpi                                ..mbed/gpi_embed.cpp:158  in _embed_init_python              Waiting for 200 seconds - attach to PID 26301 with your debugger
NOTE the PID # returned from running make with COCOTB_ATTACH. You can now connect to this process with lldb
-
lldbin a new terminal -
run
process attach --pid <PIDNUMBER>i.e.process attach --pid 12345 -
refer to lldb man pages for how to step, set breakpoints, etc.
useful commands:
image lookup -vn gpi_get_handle_by_nammemory read -s1 -fu -c10000 0x<address> --forcebreakpoint set --name <name of function>